
There are many packages available to display Ethernet network traffic on Linux. Here we’ll cover five of our favorites. Based on our assessment and decades of networking experience, these are the most useful, powerful and stable packages. In these examples, we use Ubuntu 18.04 LTS. However, we have verified these packages to work equally well on Ubuntu 16.04 using the same installation and launch commands.
-
iptraf
This is a powerful text based monitoring tool. It will display connection information as well as summary of packets crossing the Ethernet interface.
Installation
sudo apt-get install iptraf
The command line help output lists available options. However, upon start of the application the main menu pops open allowing the user to specify the configuration needed.
To run the utility, issue the command “sudo iptraf-ng”. You must have super-user access to run this utility.
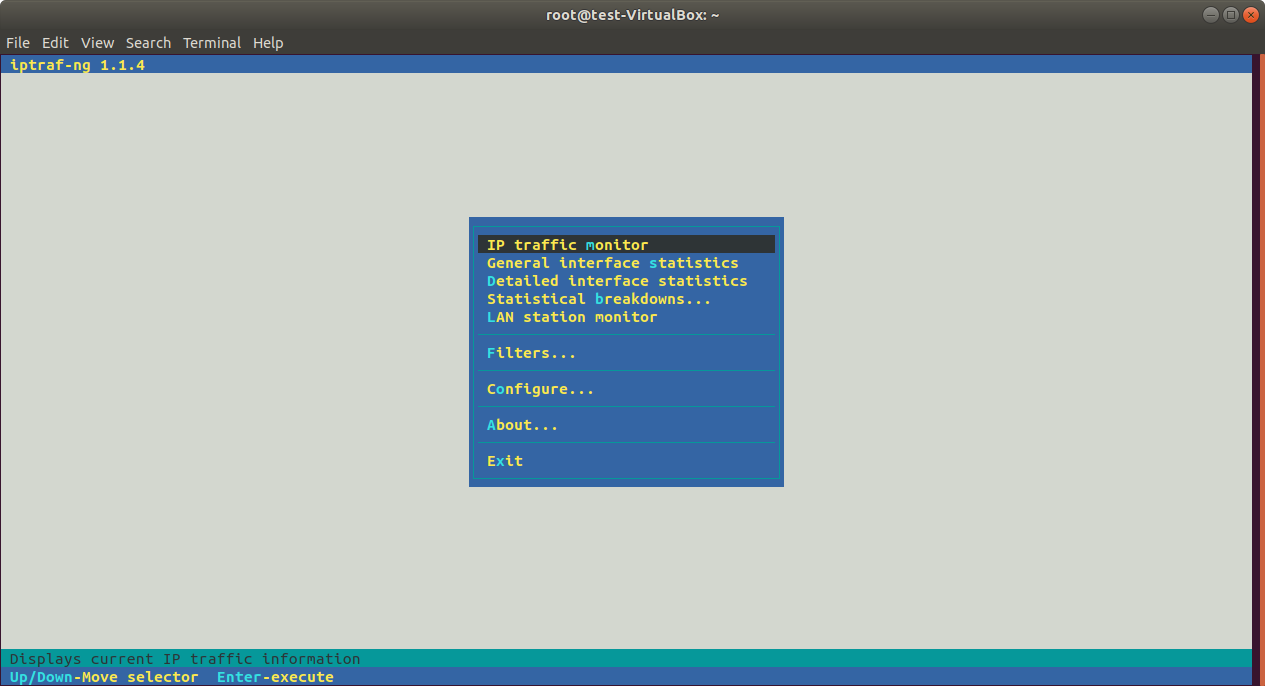
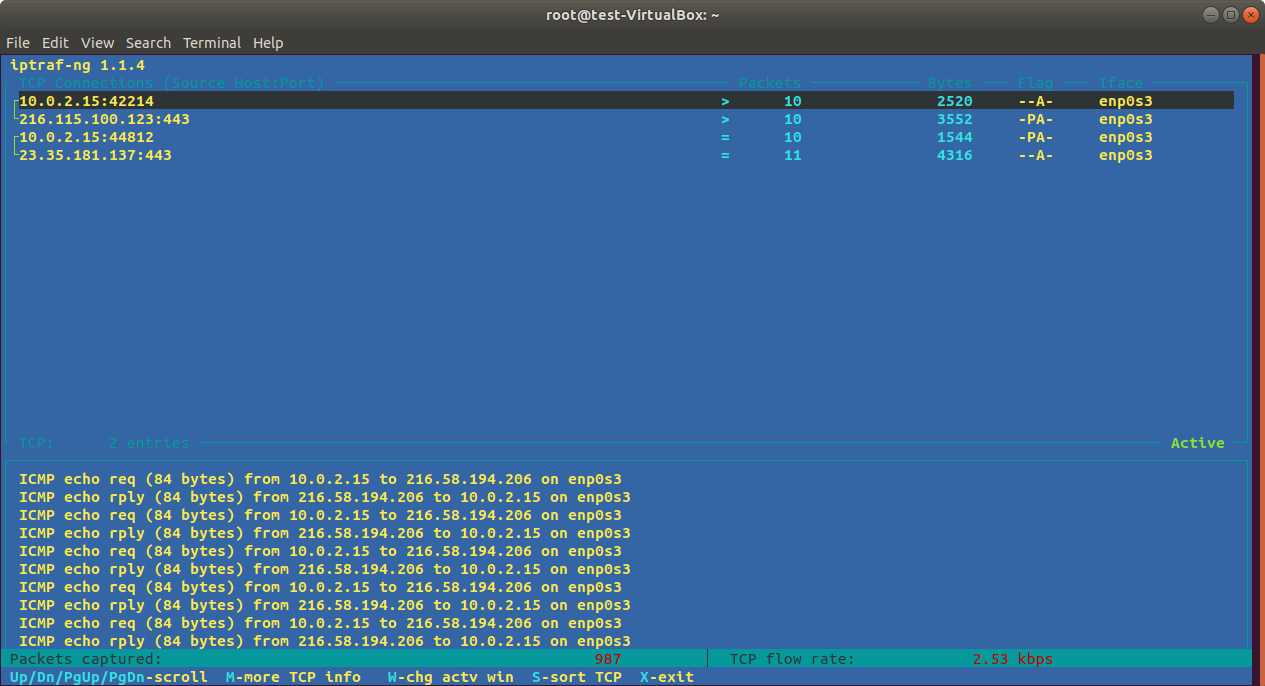
Select any of the available options. The first option “IP traffic monitor” is the most common option used, perhaps because it is the first option. Below is a sample run display of this option.
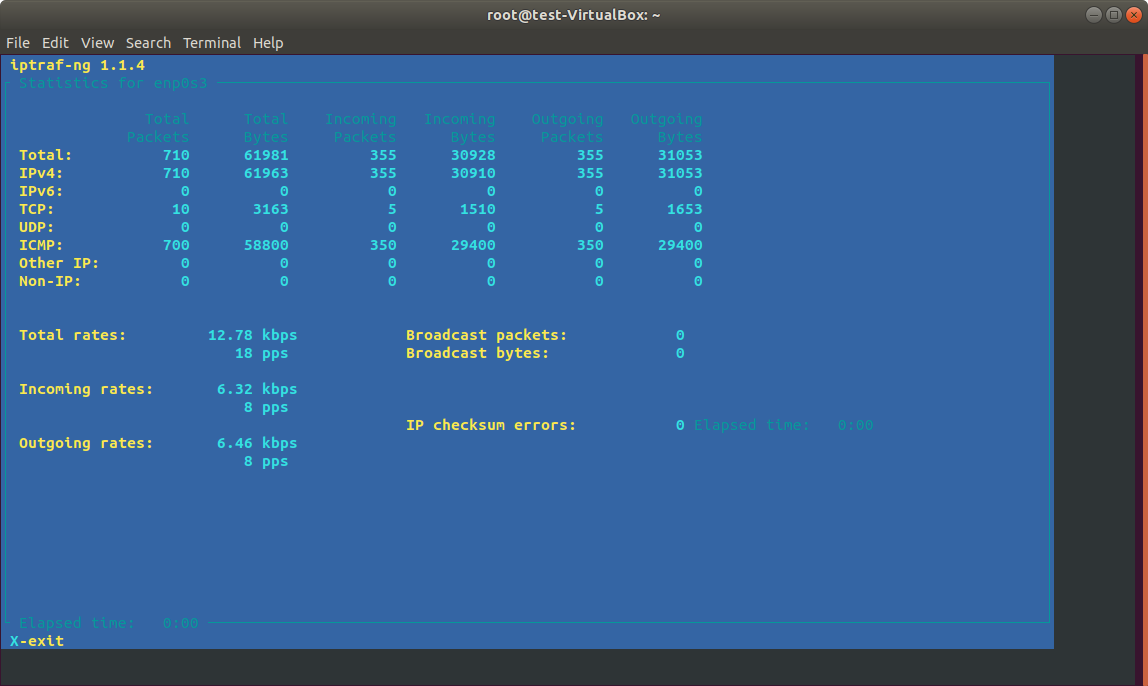
Alternatively, you can see interface statistics screen by selecting “Detailed interface statistics”.
-
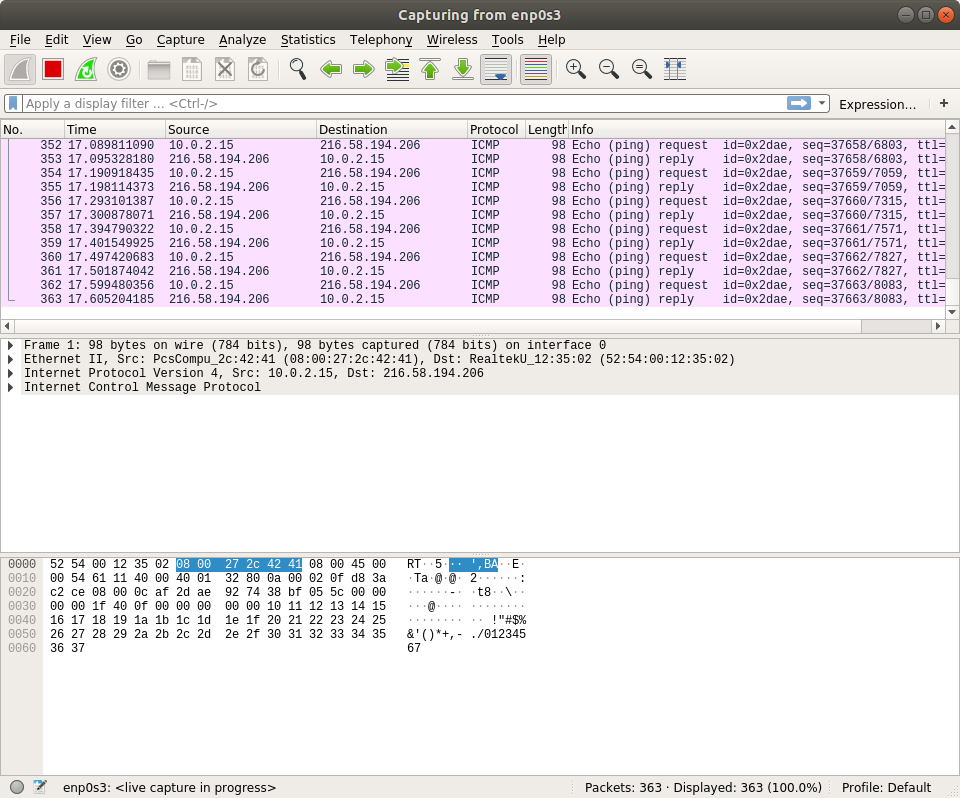
Wireshark
Wireshark is the most powerful of the five utilities discussed here and the only one that is graphic based and not text based.
Installation is straight forward using apt-get:
sudo apt-get install wireshark
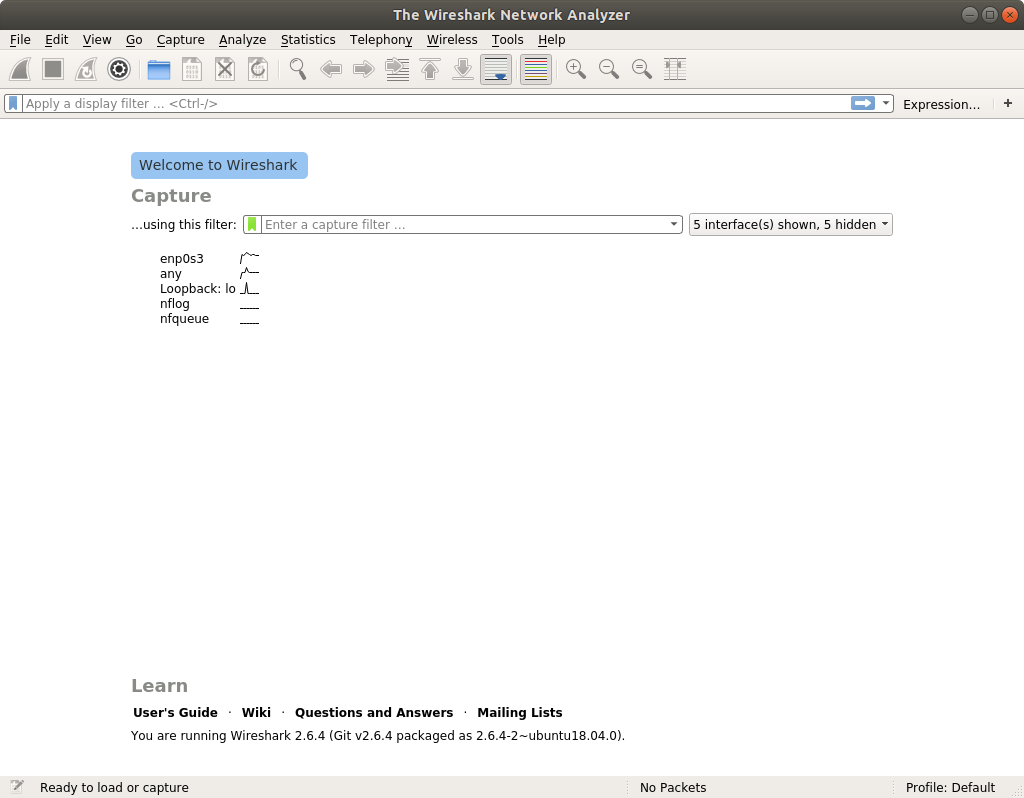
Once installed, issue the command “sudo wireshark”. If all is configured correctly, you will see a screen to select the interface(s) to be monitored. Select one and watch the live capture data.
You can start and stop the capture. Export packets to a file and so on. Wireshark is loaded with lots of options and features. The full extent of the Wireshark feature set more suitable for another article and will likely be included soon.
-
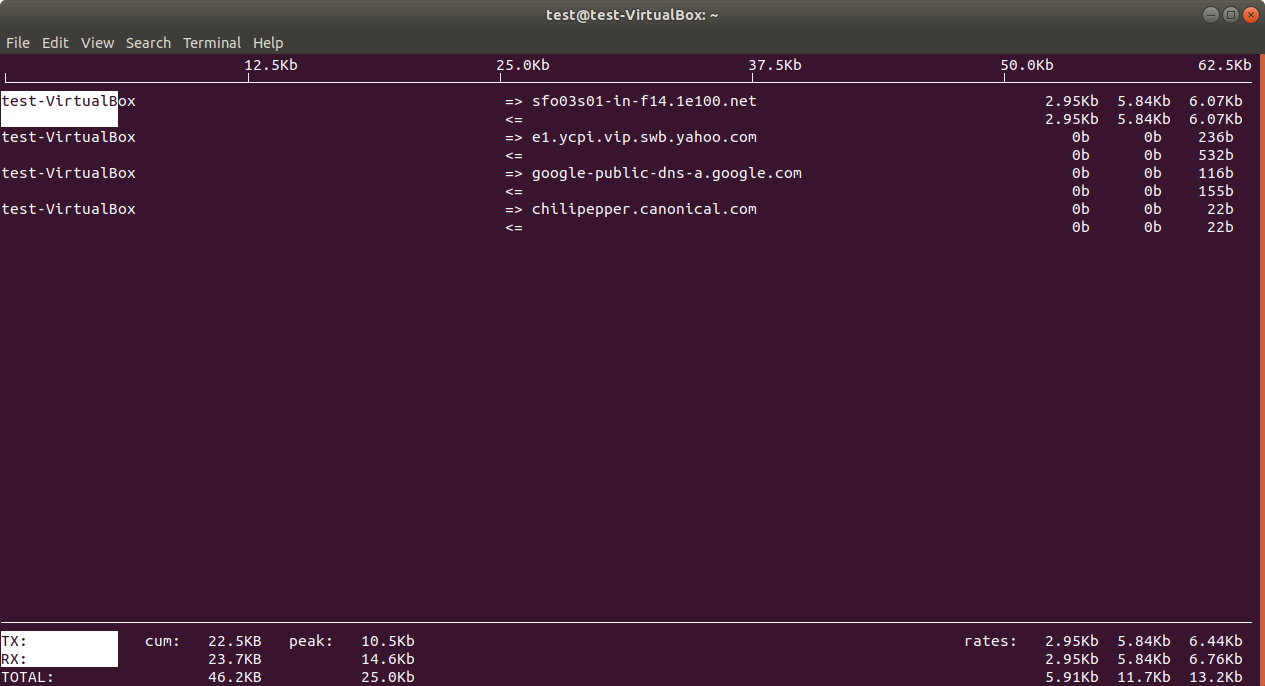
iftop
Installation
Simply use the apt-get command to install:
sudo apt-get install iftop
To run, issue the command. You need to run this as super-user so, sudo is needed:
sudo iftop
-
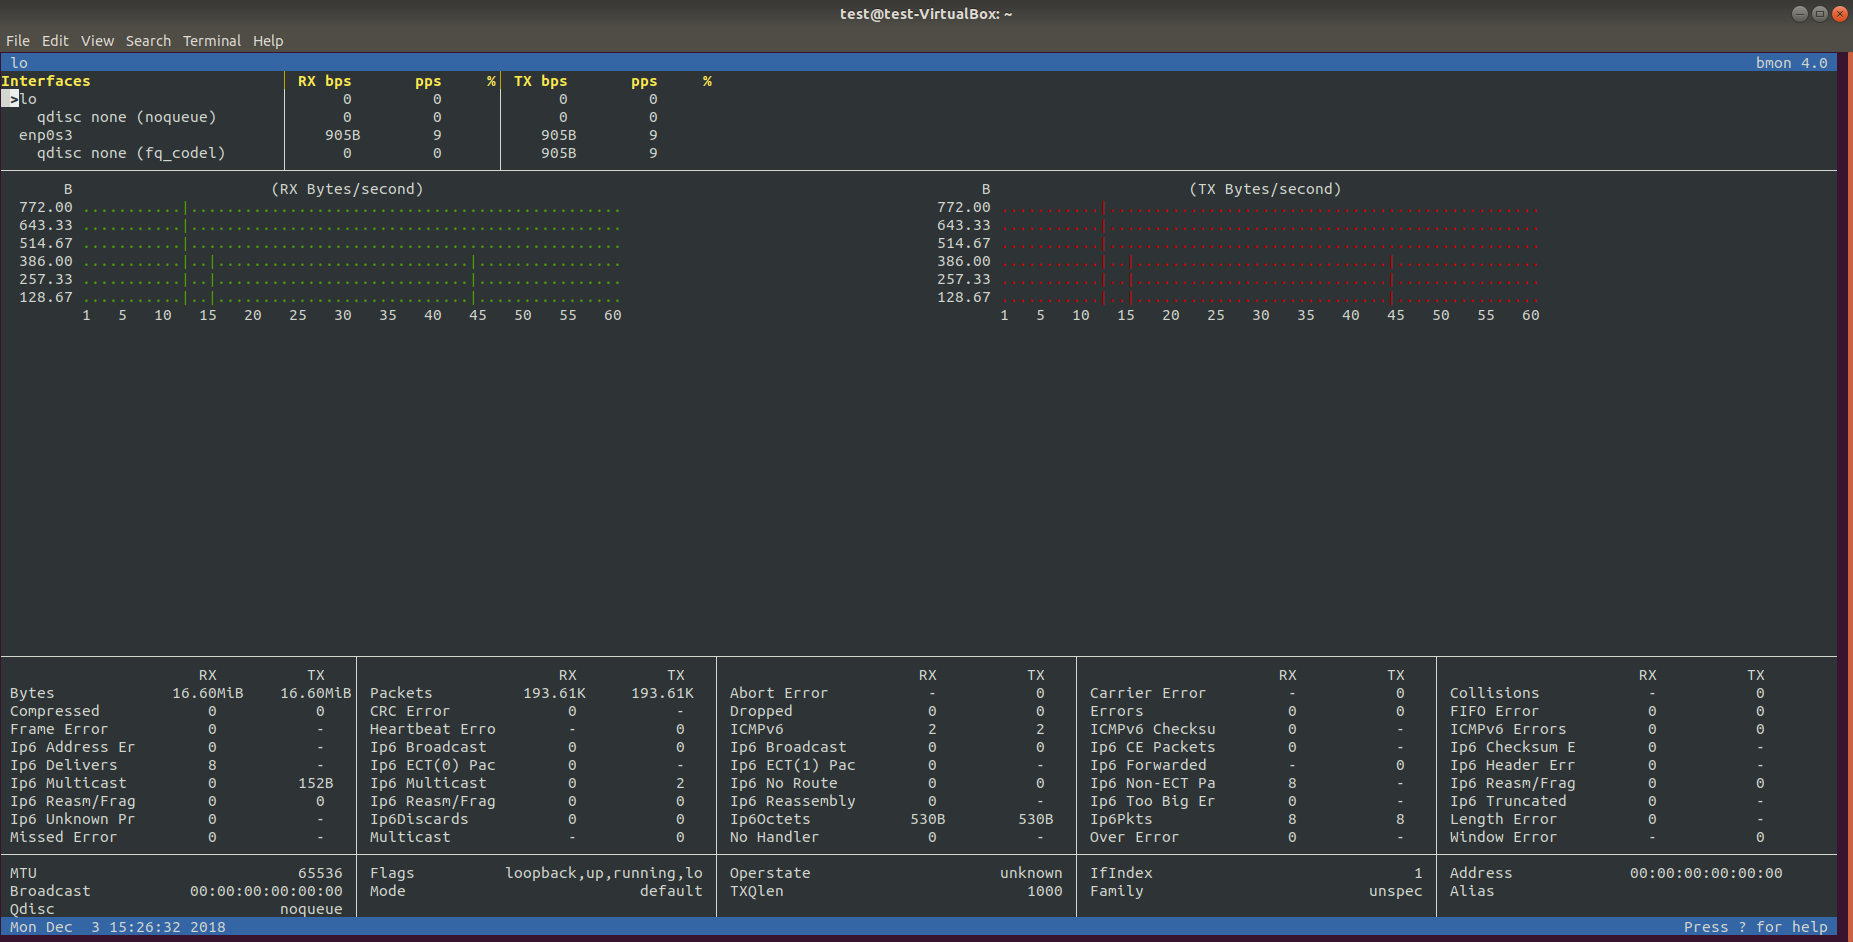
bmon
This package is similar to iftop, but with slightly more information.
Installation
Once again use apt-get:
sudo apt-get install bmon
You do not have to run bmon as superuser:
Issue the command in the terminal.
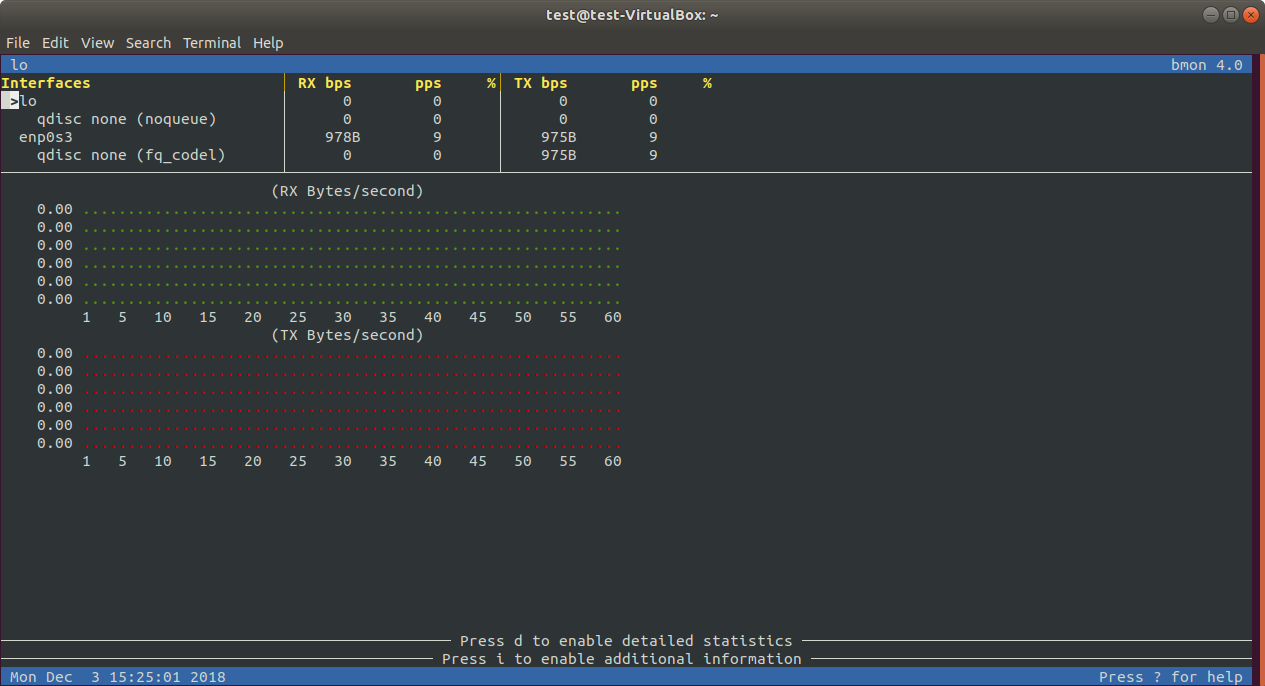
You can switch between different information and turn the sub-screens off and on with simple letter commands.
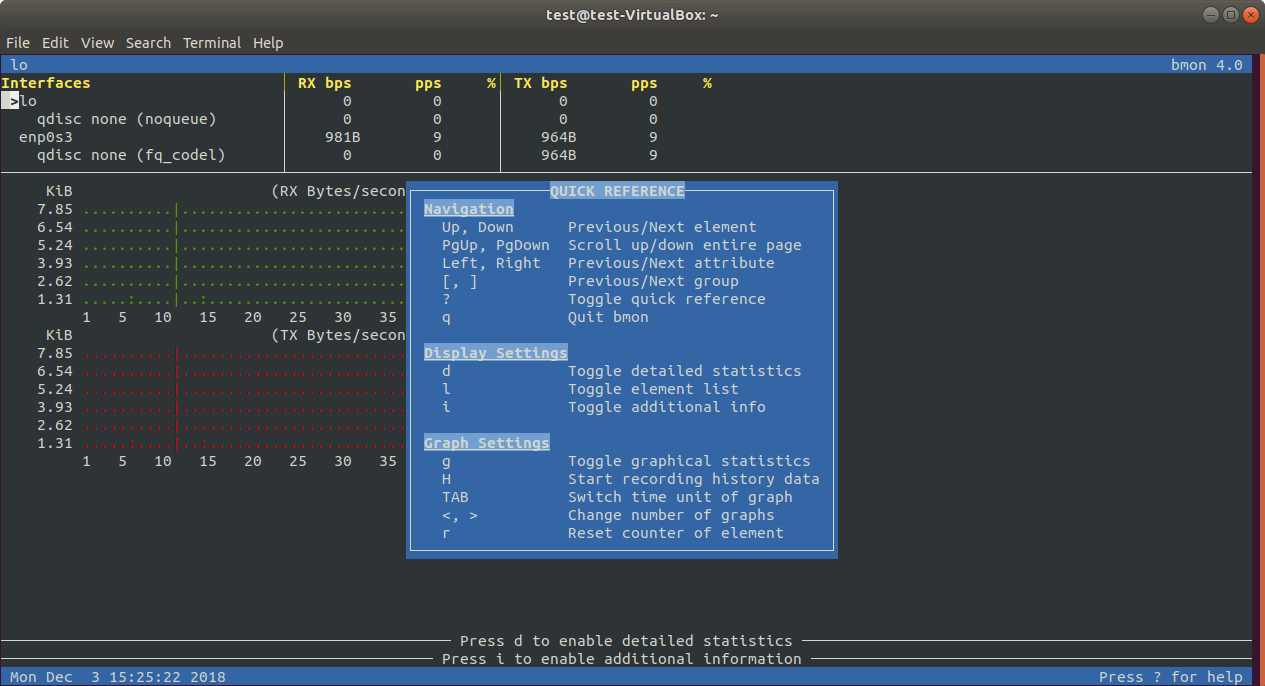
For example, after issuing the “i” and “d” commands at any-time within the window, you will see interface real time statics and port configuration.
-
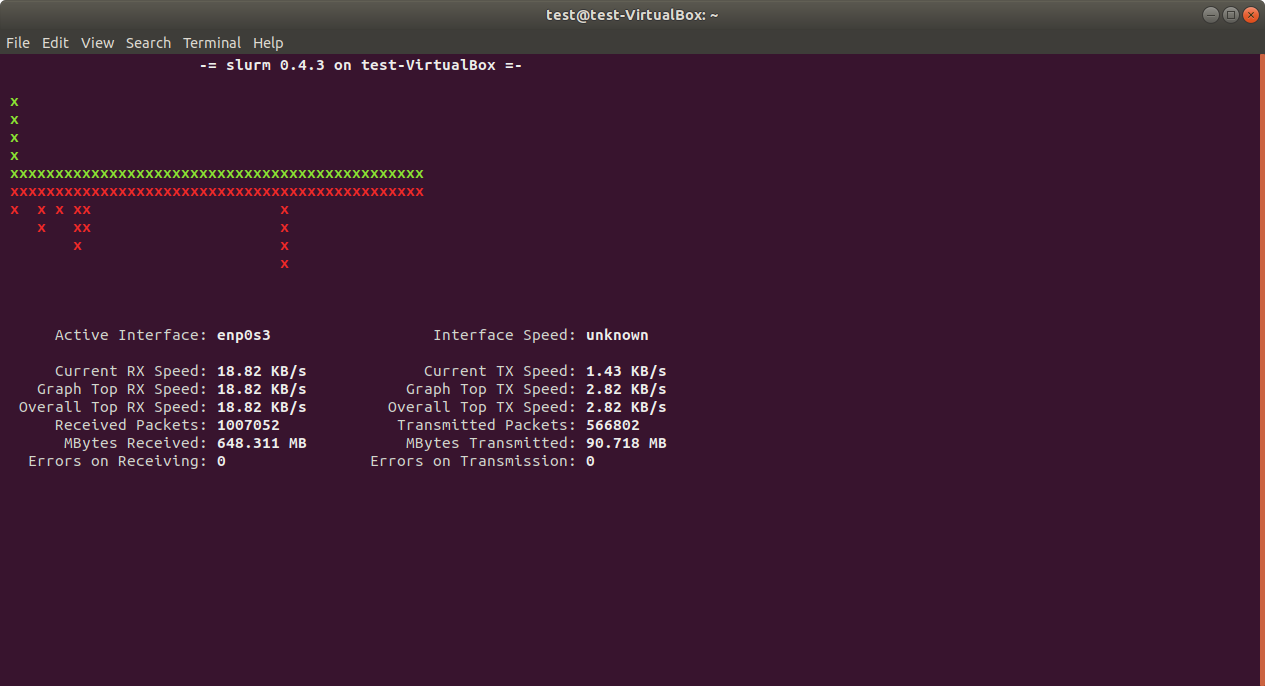
Slurm
This package is another text based tool and includes a variation in real time graphing compared to bmon.
Installation using the command:
sudo apt-get install slurm
To run, you must have super-user rights and include the interface to be monitored. Here is the list of parameters.
test@test-VirtualBox:~$
slurm -h
slurm 0.4.3 - https://github.com/mattthias/slurm
usage: slurm [-hHz] [-csl] [-d delay] [-t theme] -i interface
-h            print help
-z            zero counters at startup
-d delay      delay between refreshs in seconds (1 < delay < 300)
-c            old classic/combined view
-s            split window mode with stats
-l            large split window mode
-L            enable TX/RX 'leds'
-i interface  select network interface
-t theme      select a theme
Example run could be the following:
slurm -i enp0s3 -L
Here is what you should see:
Hope you find these helpful. Comments and suggestions are welcome!
![]()